Special Collection
WaterViz Session 4: Investigation 4 -Tactile Graphs
This is the fourth session in the WaterViz collection of water cycle lessons and activities.
Materials
- WaterViz Investigation 4 Facilitator Guide
- WaterViz Investigation 4 Worksheet (BRF*, PDF)
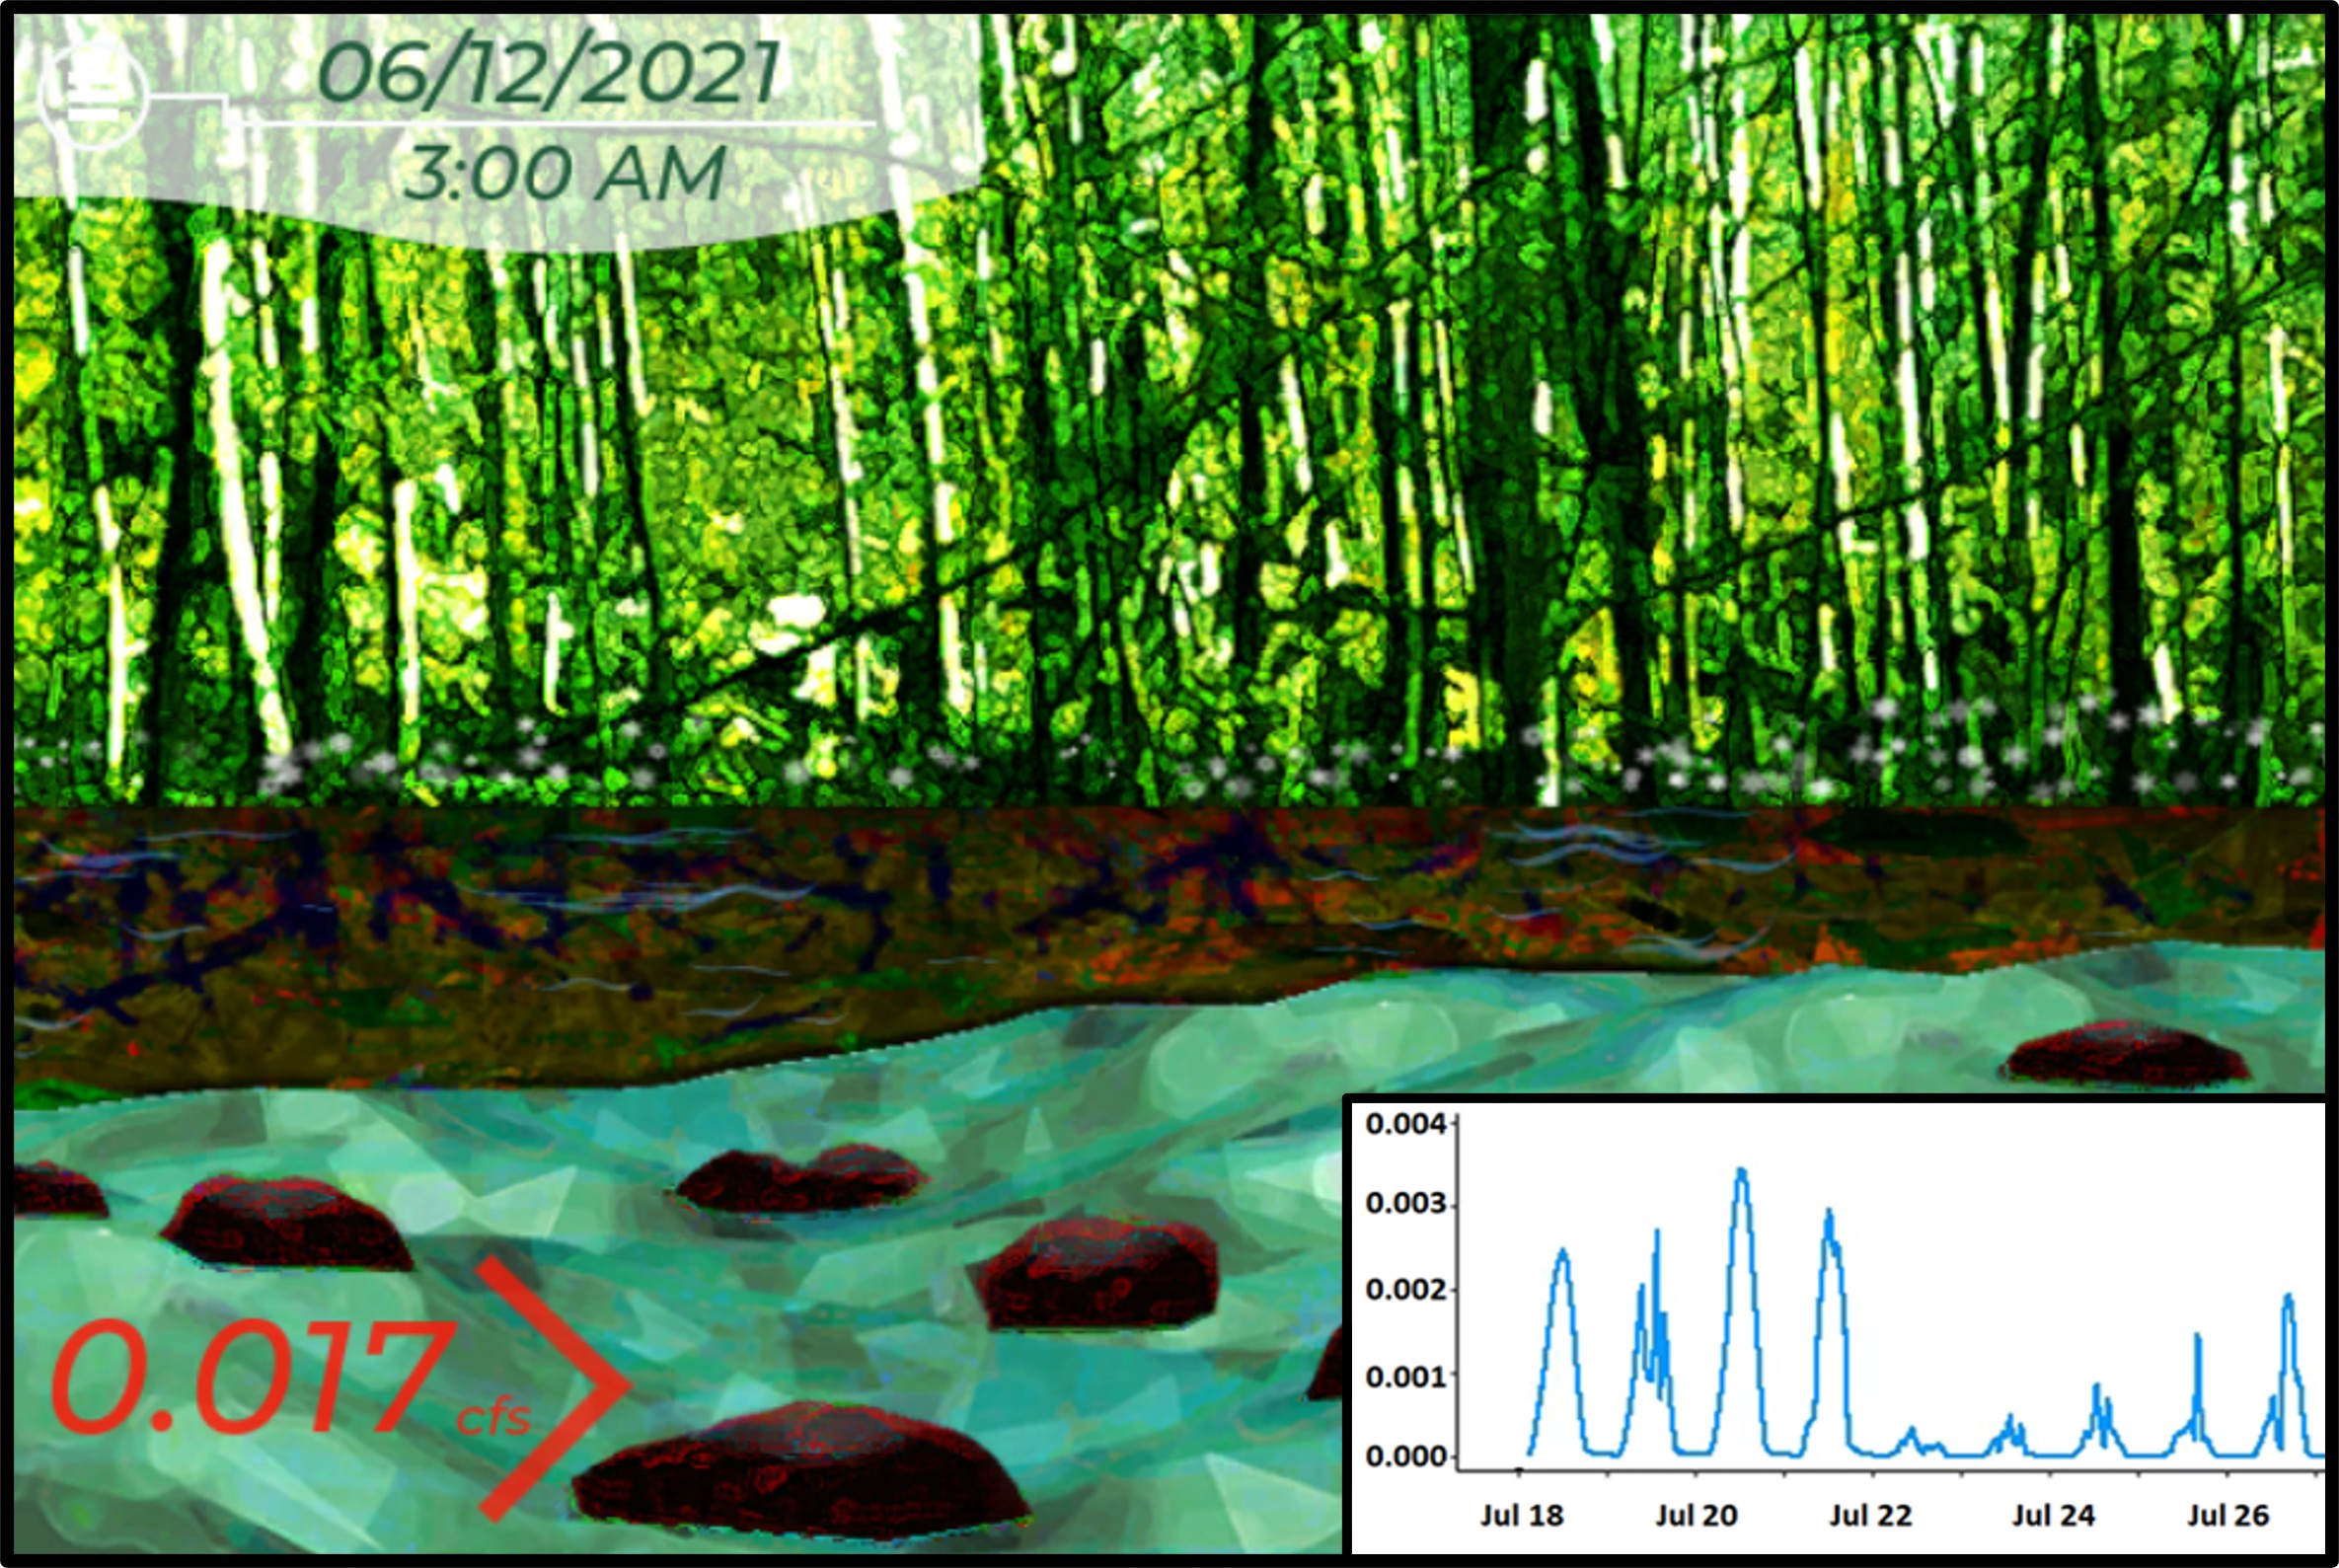
- WaterViz Water Symphony Video
- WaterViz Tactile Graphs (Nemeth)
- WaterViz Tactile Graphs (UEB)
- Investigation 4 Graphs Transcriber’s Note (BRF*)
- WaterViz Graphs (pdf)
- WaterViz Videos
Activities
- Analyzing Tactile Graphs: After reviewing the water cycle trends identified in the 2018 summer rain event using the article, animated art, and musical data, teams investigate a series of tactile graphs to determine the water cycle component data represented by each graph and assign the correct y-axis units.
- Preparing for the Transpiration Experiment: Environmental scientists preview materials, methods, and expectations for the transpiration experiment that they will conduct independently.
* If you have difficulty downloading a BRF file, see these tips.