Special Collection
WaterViz Session 5: Investigation 5
This is the fifth session in the WaterViz collection of water cycle lessons and activities. It includes transpiration experiment presentations, Zoom-a-Scientist, and analysis of climate data tables.
Materials
- WaterViz Investigation 5 Facilitator Guide
- WaterViz Investigation 5 Worksheet (BRF*, PDF)
Activities
- Environmental scientists present and discuss the results of their transpiration experiment including how they set up the experiment, characteristics of the plants, locations, temperature, weather conditions, evidence that transpiration occurred and differences in water collected from different plants. They also discuss changes they could make to the experiment that may produce different results.
- Environmental scientists learn about weather vs. climate and analyze climate data tables.
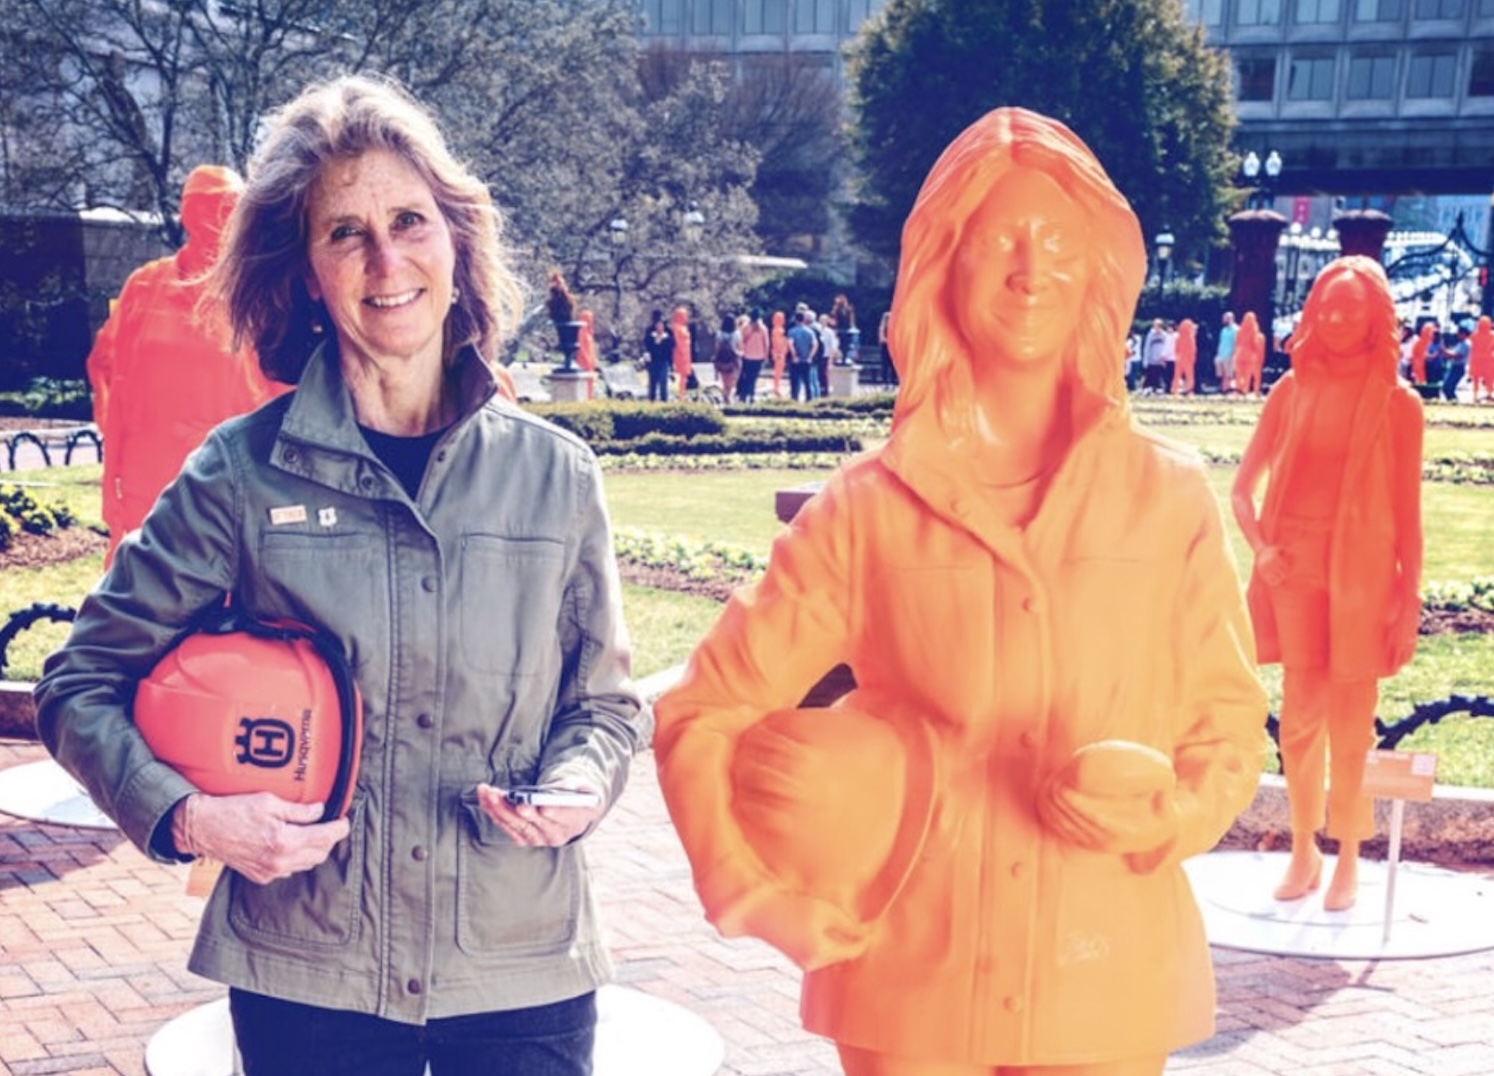
- Dr. Lindsey Rustad, Research Ecologist and WaterViz Project Lead, joined us for a fireside chat where she shared about the development of WaterViz, her work with the US Forest Service, acid rain, climate trends, and ice storm experiments. This was a highlight of the program for many of our scientists!
- At this link, Dr. Mona Minkar, a blind scientist shares her story and the stories of other blind scientists to “inspire and encourage other blind and visually impaired individuals to pursue careers in STEM, and further expand the blind scientist community”.
* If you have difficulty downloading a BRF file, see these tips.