Let’s have some fun learning about holiday traditions across cultures and develop our student’s concepts about graphic organizers!
Graphic organizers are defined as visual depictions of the relationships between facts, concepts, or ideas. Oh no!!! Visual depictions for the visually impaired??? I know that we’ve all experienced the frequency with which educational programming includes the use of graphic organizers. Finding ways to adapt them isn’t incredibly difficult, but I’m here to share an example of how one might teach students the concept of such tools in a fun and engaging way.
Background Information
I facilitated these lessons as a classroom teacher at TSBVI. Below is some information about my class and the materials we used. Ideas for expanding this unit are at the end of the article.
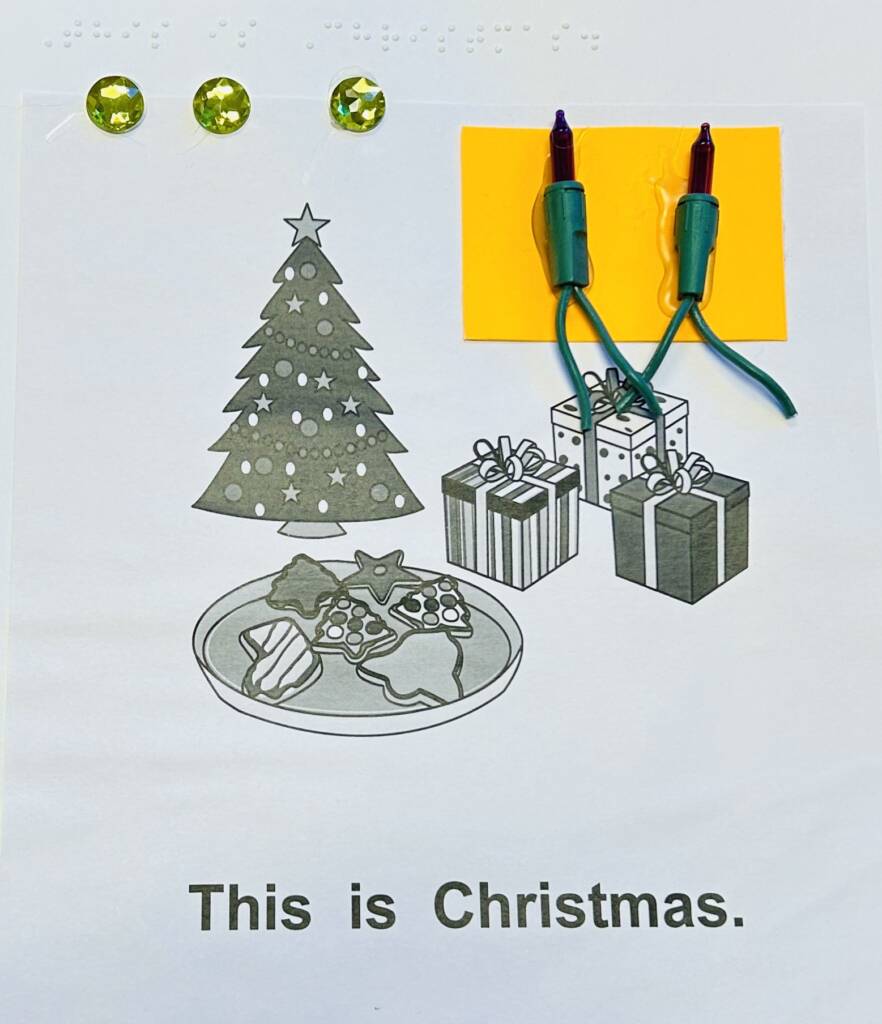
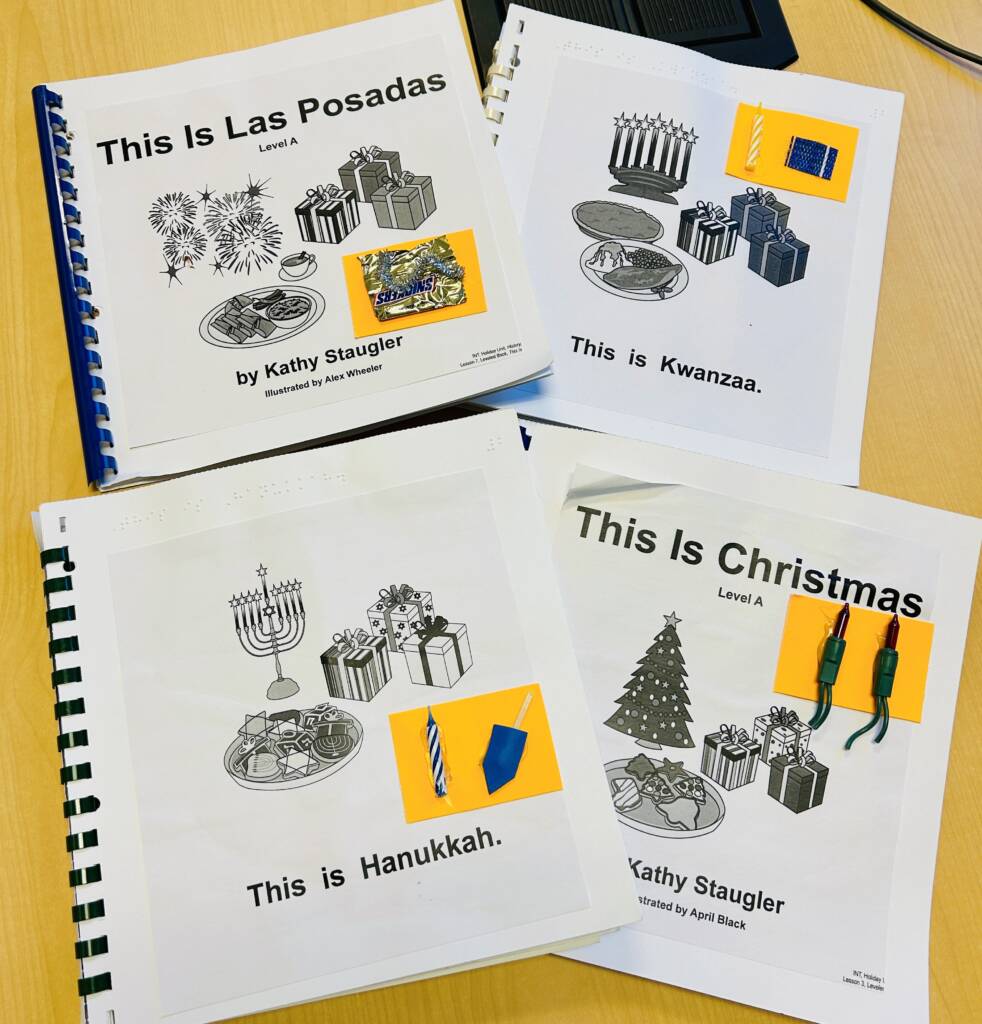
In my class, I had elementary aged students who were early readers and writers. Our primary literacy medium was tactile symbols, and early braille. The materials I used were from the December unit of the Unique Learning Curriculum, but you could write these books, or something similar yourself or with your students. I created large versions of the graphic organizers to hang on the wall and interact with during group time and personal sized ones for 1:1 instruction, reteaching, and assessment.
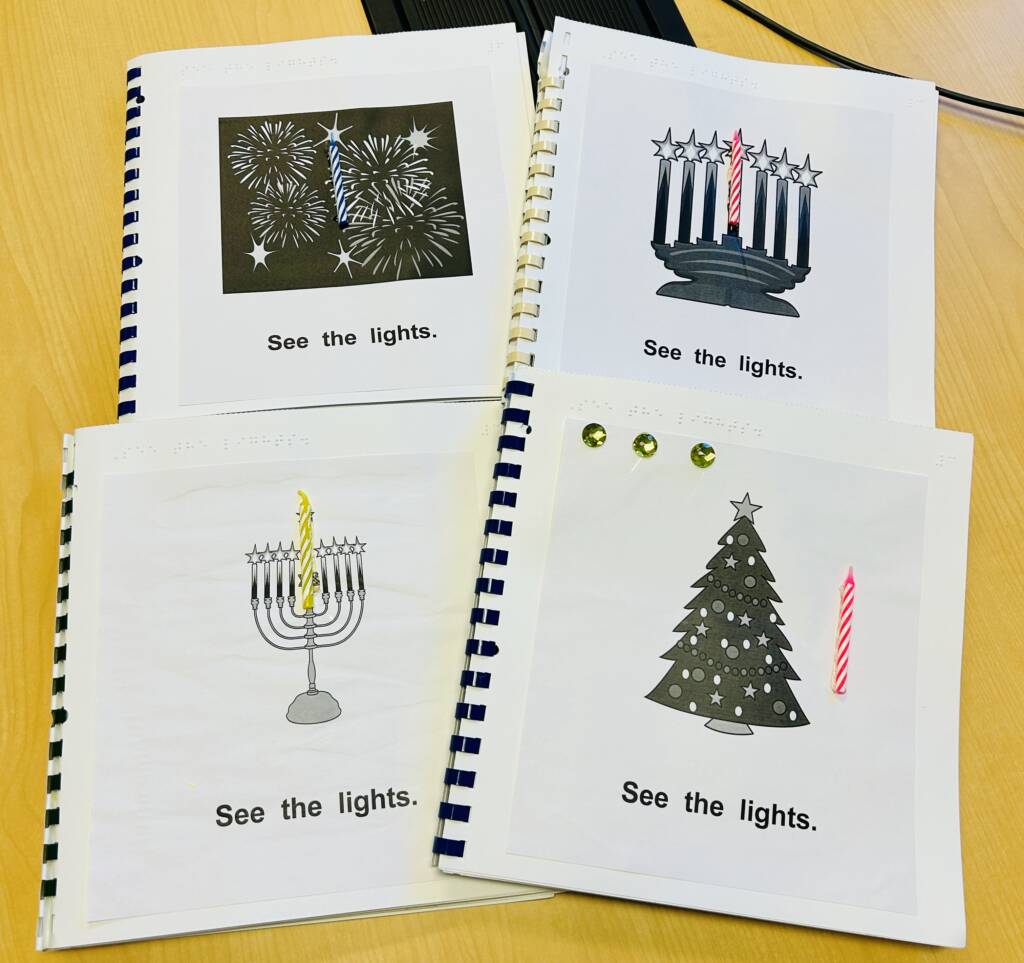
For 4 weeks, we read about a different holiday celebrated around the world. They were Christmas, Hanukkah, Kwanzaa, and Las Posadas. We used kid-friendly websites to learn the names of relevant artifacts within these holidays (menorah, dreidel, mkeka, kinara, piñata, 7-point star, Christmas tree, ornaments). The graphic organizers I focused on with this group of students were concept webs, T-charts, and Venn Diagrams.
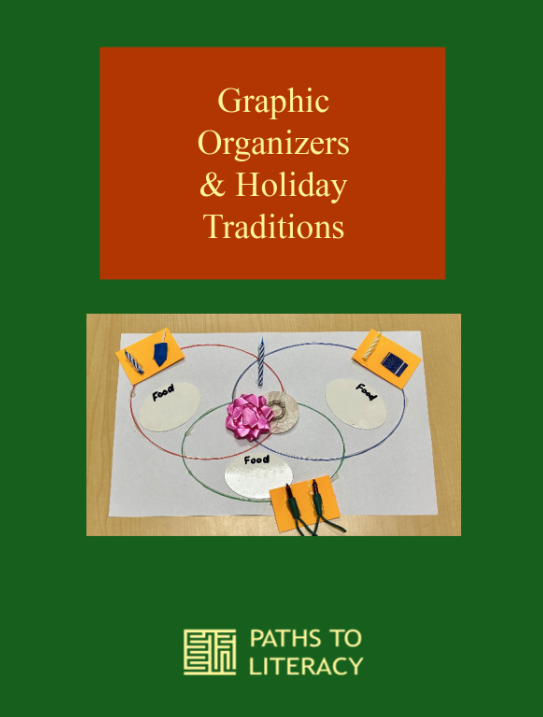
As we read about each holiday, we completed a concept web to help us organize the information we encountered. A concept web helps connect abstract ideas and new information. Visually, these diagrams typically include a central circle for the main topic or question and lines that extend out to connect new information. For some students, this was done in one level, and for others, we expanded to additional levels.
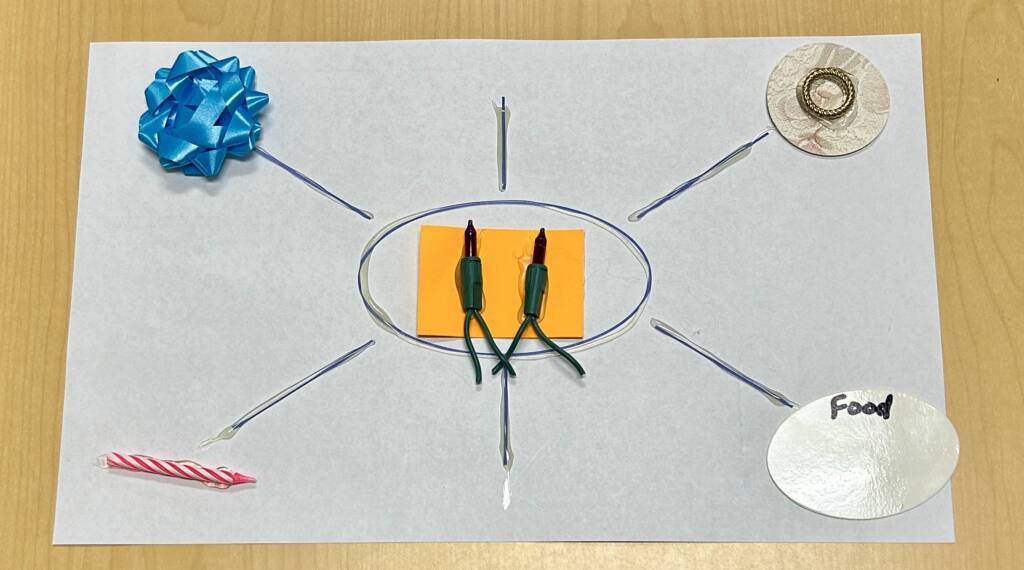
For example:
- Central circle of the web: Hanukkah
- 1st level information: Candles, 8 nights, family, food, gifts
- 2nd level information: Menorah, dreidel game, latkes, one gift per night (traditions vary)
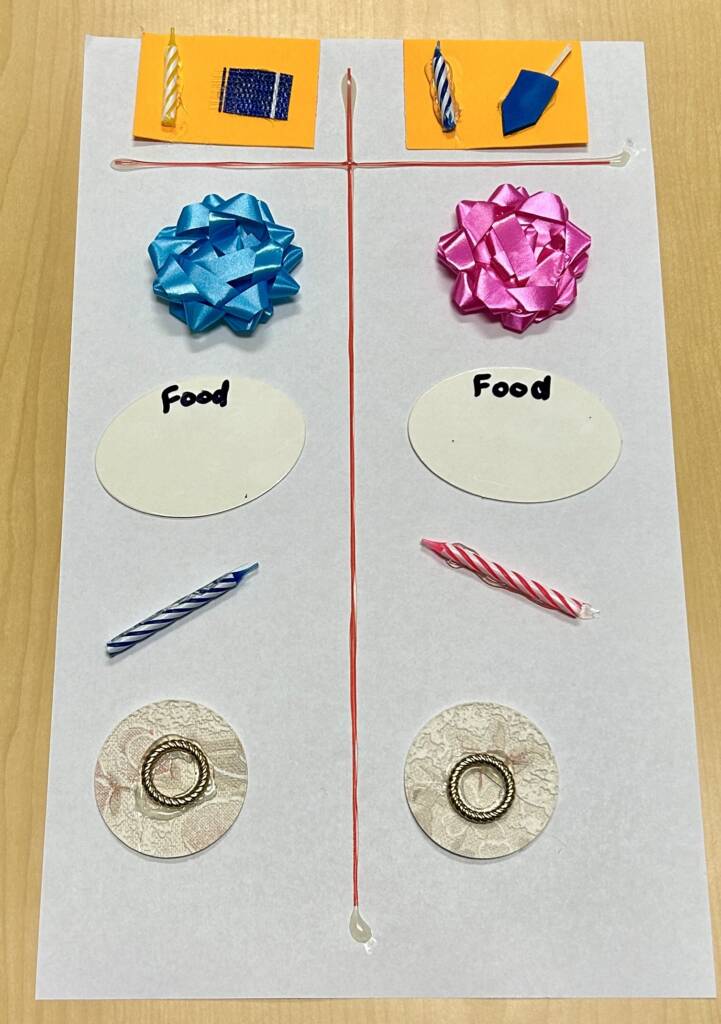
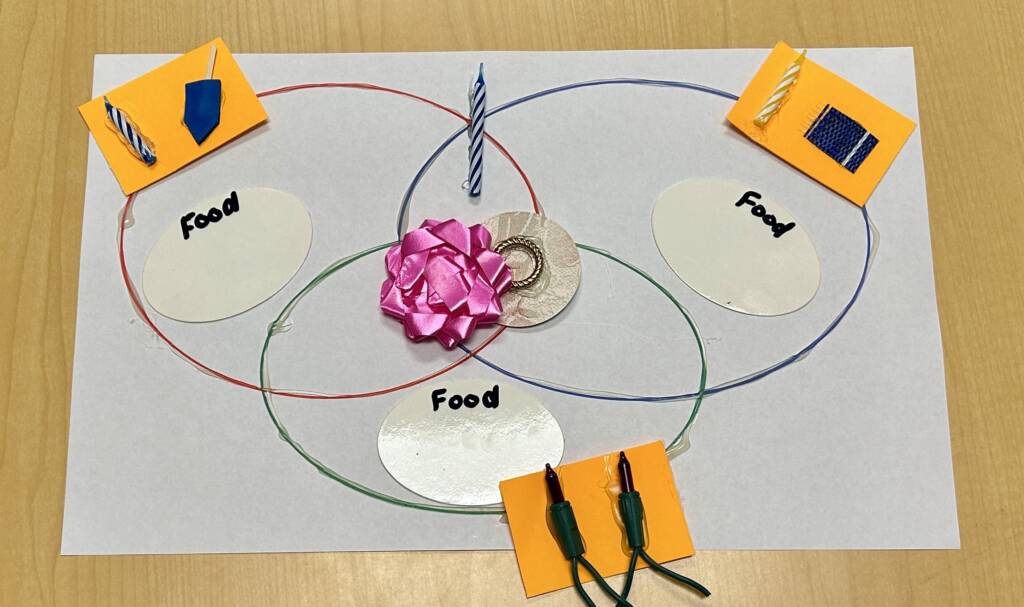
When we had discussed two holidays, we created a T-chart to discuss similarities. In this T-shaped graphic organizer, students are asked to compare or contrast two main topics or ideas. As we progressed through the unit, we changed out the holidays and compared each one to another. After completing the unit, we selected 3 holidays by choice, and for assessment, at random, and we compared them using a Venn Diagram. During each week, students explored traditional artifacts and participated in a variety of activities across content areas to further their understanding of the concepts related to these holidays. They were excited each week to go home and tell their families about the special holiday we had discussed.
Adaptations and Extensions
- My students used tactile symbols, many of which I invented on my own using the TSBVI tactile symbol library as a guide. These were glued into the books, but I also had an extra set from each book to use on the charts and in felt folders where my students journaled about what they had learned. I used Velcro to make my charts reusable for other units or topics.
- For students using braille or large print, cards can be created to move around tactile graphic organizers, and students can write facts on paper to keep the information organized and practice literacy.
- Create tactile versions of graphic organizers using Wikki-Stix, yarn, puff paint, or digital methods.
- Encourage students to write or share about their families’ traditions around the holidays. How do they compare with what you’re learning in class?
- Use graphic organizers for other preferred topics such as favorite foods, toys, or activities.
- Use a PenFriend to support auditory learners. The PenFriend is a recordable device that comes with many stickers which can be placed on just about anything. These stickers work with the pen and your voice to record and play-back information. We used these during units where it would have been difficult to create a set of tactile symbols for each word in advance or where student responses might have been unpredictable ahead of time.
- Some activities students participated in to support our learning included making a piñata by hand, counting candles and lights, making Kwanzaa mats (mkekas), playing with a dreidel, wrapping gifts, decorating a classroom Christmas tree, and various cooking activities.
NOTE: You may have noticed in one of the books, each page has 3 colored gems under the braille words. These are to support tracking for students who are beginning to learn braille.
Happy Celebrating!