Tips and guides
Interactive Diagrams or Data Visualizations
Information and resources on interactive diagrams or data visualizations for students who are blind or visually impaired
I just shared some information about interactive diagrams (or “data visualizations”) with TVIs in many of our iPad trainings and thought this is information that everyone might want to know!
As our classrooms move towards digital classrooms (digital textbooks, on-line assessments, etc.) one of the biggest issues for students with visual impairment or blindness is how these students will access digital images, charts, and graphs.
The data visualizations listed below are possible solutions – accessible digital images! The first links are to early prototypes created by Ed Summers and his accessibility team at SAS; these data visualizations were created several years ago. Try the interactive Census Map and the interactive Periodic Table with your students. There are additional interactive diagrams on this website as well.
Interactive Diagrams
These interactive diagrams are for the iPad (only); they are accessible with VoiceOver (VO).
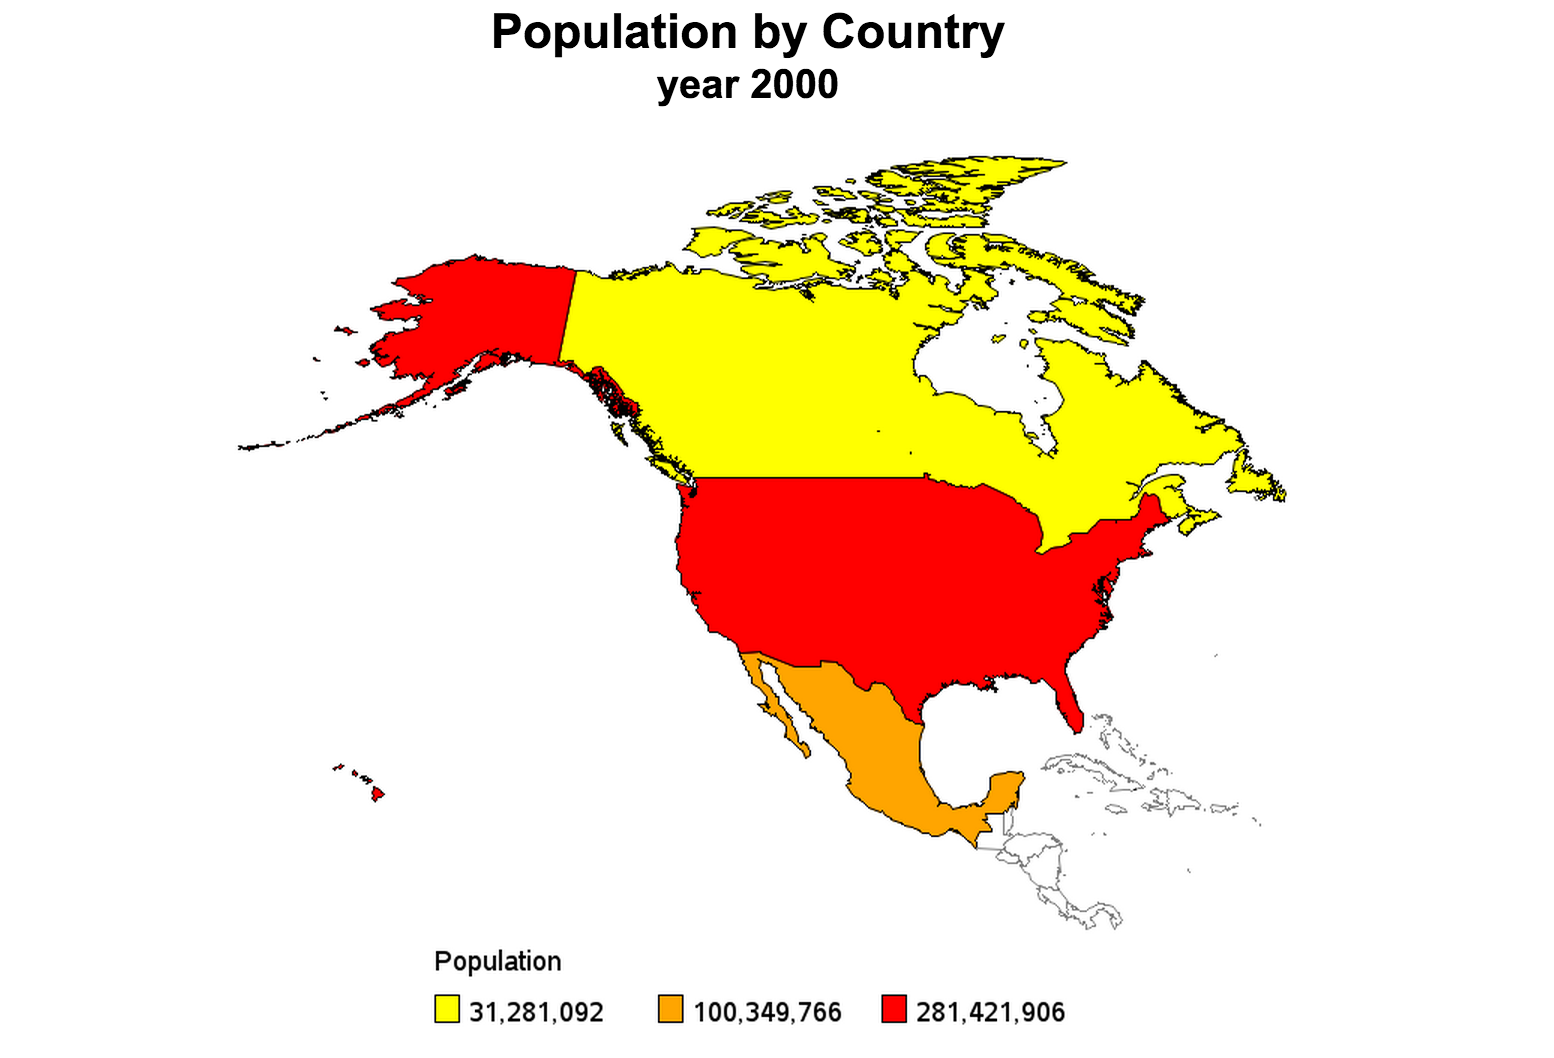
To go directly to the Census Map:
http://support.sas.com/misc/accessibility/CensusMap/census1.htm
Once on the map with VO on, drag your finger around the map to hear the different areas. Split tap (or double tap) to “drill down”, meaning if you want to explore the United States, then drag your finger to the US and split tap. Now the screen will show just the US – including each state. Drag your finger around the states to learn spatial relationships (where is NC in relationship to SC? Where is California?) Split tap again on a specific state and the screen will change to show just that state and the counties in that state. The map is connected to the 2000 census, so additional information is available about each county.
Data Visualizations
To see other interactive “data visualizations” go to:
http://support.sas.com/misc/accessibility/education/
Under Research and Development, click on Gallery of Accessible Data Visualizations, then click on Census Map, periodic table, etc.
The iBook “Reach for the Stars: Touch, Look, Listen, Learn” incorporates new data visualizations into that astronomy textbook. “Reach” is a free iBook available in the iBook Store. To download Reach, go to: https://itunes.apple.com/us/book/reach-for-stars-touch-look/id763516126?mt=11?
Stay tuned for next generation of data visualizations!